Documentation
Everything you need to know to get started with Squigglify
Quick Start Guide
- 1Navigate to the Generator
Click the "Generator" link in the navigation or on the home page
- 2Upload or Select an Image
Either upload an image or use the random image loader to pick one from Wikimedia Commons
- 3Adjust Settings
Choose a processing mode and adjust parameters like density, tiling, and curve controls
- 4Download the SVG
Export in SVG, PNG, or PDF format for use in plotting software or design applications
Processing Modes
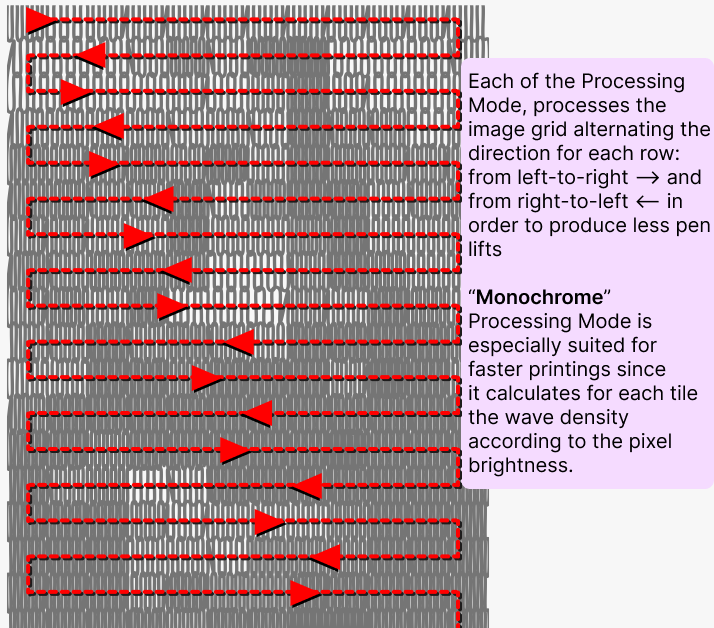
Monochrome Mode
Converts an image to a single color with wave paths of varying density based on brightness. Perfect for simple, one-color pen plots. Paths are optimized for less pen lifts and more efficient plotting.
Best For:
- • Single-pen plotter drawings
- • Clean, minimalist artwork
- • Quick test plots
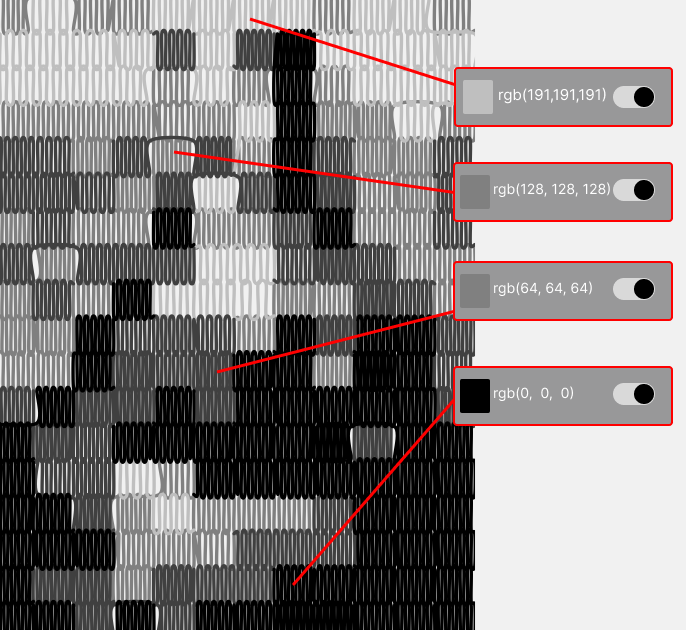
Grayscale Mode
Creates multiple layers of wave paths with different densities to represent different brightness levels, resulting in more detailed representations with depth.
Best For:
- • Multi-layer pen plots
- • Detailed portraits and landscapes
- • Gradual tonal transitions
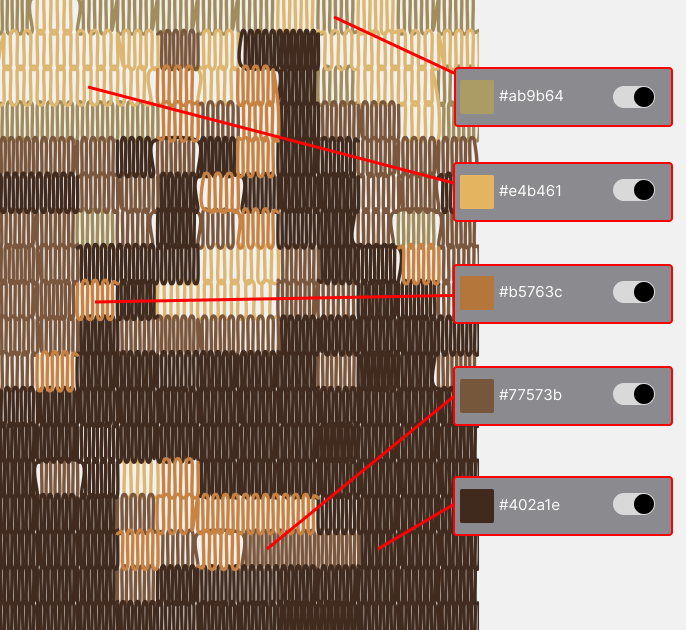
Posterize Mode
Reduces the image to a limited color palette using K-means clustering, creating separate path-groups for each color. Ideal for stylized but coloured, graphic representations. The output is optimized for less pen lifts and more efficient plotting.
Best For:
- • Minimal multi-color pen plots (up to 16 colors)
- • Pop art style artwork
- • Colorful, designs
Settings Guide
Tiling (Columns & Rows)
Controls the grid resolution. Higher values = more detail but slower processing.
💡 Tip: higher values = more detail but slower processing.
Density (Min/Max)
Controls how many zigzag lines are drawn per tile. Higher max density = darker areas with more lines.
💡 Tip: the higher the difference between min and max density, the more detailed the output will be.
when using Monochrome Processing mode, min and max density shouldn't be the same.
Brightness Threshold
only pixel areas darker than this threshold are considered for path generation.
💡 Tip: Lower the threshold to remove light areas from the output.
Continuous Paths
When enabled, connects paths of the same color to minimize pen lifts during plotting.
💡 Tip: use the Path Connection Threshold setting to control the distance between paths.
Curved / Square Paths
Toggle between edged corner and smooth curves using Bézier curves. Adjust smoothness and rotation for organic effects.
💡 Tip: Toggle on for more hand-drawn, natural appearance
Rows height
Adjust the relative height of the rows (based on the square paths). curved paths results in taller rows because of beziers depending on the curve smoothness.
💡 Tip: Lower the row height when using pen or tool a wide stroke width.
Stroke Width
Adjust the width of the paths.
💡 Tip: you can simulate a wider stroke width by increasing this value.
Color Amount (only available in Posterize and Grayscale Mode)
Number of colors to reduce the image to. Uses K-means clustering algorithm.
💡 Tip: use 5-12 colors for balanced results
Advanced Shape Controls
These controls allow fine-tuning of the generated vector shapes. They modify how individual knot points and path segments are positioned, displaced, and shaped. All controls can be reset to defaults via the Reset button in the settings panel.
Curve Smoothness
only available when Curved Paths is enabled
Controls how smooth the Bézier curves are between points. Higher values create smoother, more flowing curves while lower values create tighter, more angular transitions between segments.
Range: 0.01 – 0.50 | Default: 0.15
💡 Tip: low values (0.01–0.05) give a pointy, aggressive look. Values around 0.15–0.25 are natural and balanced.
Lower Knot X Shift
Shifts the horizontal (X) position of the lower knot points in each tile. The range is based on half the tile width in each direction. This effectively tilts or skews the zigzag pattern left or right.
Range: –(tileWidth/2) to +(tileWidth/2) | Default: 0
💡 Tip: use small values for a subtle italic-like slant; extreme values produce dramatic diagonal patterns.
Upper Knot Explode
Controls the magnitude of random displacement applied to upper knot points. At 0%, the upper knots stay in their default positions. At 100%, a pre-calculated random shift is fully applied, making the peaks of the zigzag pattern irregular and organic.
Range: 0% – 100% | Default: 0%
💡 Tip: subtle values (10–30%) add a hand-drawn feel. Higher values create chaotic, abstract textures.
Disorganize
Applies random displacement to every point in each path — both upper and lower knots. At 0%, paths remain perfectly structured. Increasing the value progressively scatters all points, creating an increasingly chaotic and hand-drawn aesthetic.
Range: 0% – 100% | Default: 0%
💡 Tip: combine with Curve Smoothness for organic, sketchy styles. Values above 50% can significantly distort the image.
Row Wave Height
modulates the row height based on a sinusoidal wave pattern.
Range: –100% to +100% | Default: 0%
💡 Tip: negative values invert the wave direction. Works best combined with Column Wave Shift and Wave Frequency.
Column Wave Shift
shift vertically paths according to a sinusoidal wave pattern. Entire columns are shifted vertically based on a cosine function of the row position, producing vertical undulations through the artwork.
Range: –100% to +100% | Default: 0%
💡 Tip: combine with Row Wave Height and adjust Wave Frequency to create complex interference patterns like moiré effects.
Wave Frequency
Controls the frequency of both Row Wave Height and Column Wave Shift patterns. Higher values create more wave cycles across the grid (tighter waves), while lower values produce fewer, broader waves.
Range: 0.5 – dynamic (based on column count) | Default: 2.0
💡 Tip: this control has no visible effect unless Row Wave Height or Column Wave Shift is non-zero.
Export Options
SVG
Vector format, scales infinitely without quality loss
✓ Pen plotters
✓ Laser cutters
✓ Design software
Document format preserving vector quality
✓ Print publishing
✓ Archiving
✓ Professional use
PNG
Raster format for preview and sharing
✓ Social media
✓ Quick previews
✓ Print
Software Compatibility
The generated SVG files are compatible for use with popular vector graphics software like:
- • Inkscape
- • Adobe Illustrator
- • Affinity Designer
- • and many more...